Implement PanTompkins ECG waveform R-Peak Recognition on RT-Thread+RA6M4
Implement PanTompkins ECG waveform R-Peak Recognition on RT-Thread+RA6M4
By David528
Features
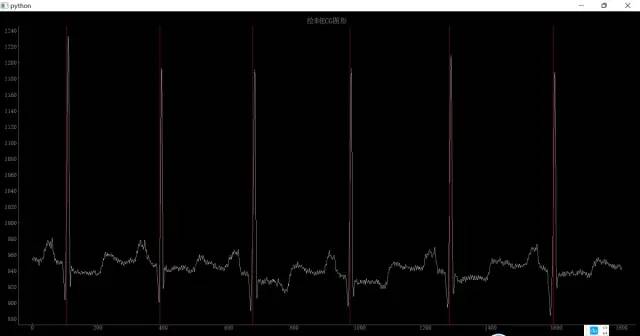
Generally, the traditional mathematical morphological method is the way that we're taking as the main method of ECG signal waveform recognition. In the morphological method, the recognition of R-peak is the foundation of the other waveform recognition. In this project, we're going to port the open source PanTompkins and do some transformation works, and an R-peak recognition technology implementation for producer and consumer models of RT-Thread systems will be added. Based on the collected ECG data, the ECG waveform is drawn in real time and the R peak is identified, and the ECG waveform graph (white) and the marked position (red vertical line) of the R peak recognition are plotted in the example below.

Steps to follow
1. Create the project
Download/ Open RT-Studio IDE to create a new RT-Thread project based on the Renesas CPK-RA6M4 board.
2. Disable the system console and shell serial port input and output:
As I have only one serial port converter(USB to ttl), so I need to disable the system console and shell serial port imput and output, I can then use this serial port independently for the input of ECG data and the output of the calculation result.
In the configuration header file rconfig.h, disable the following configuration:
1. Disable the console serial output
2. //#define RT_USING_CONSOLE
3. Disbale Shell:
4. //#define RT_USING_FINSH
3. Access the hardware
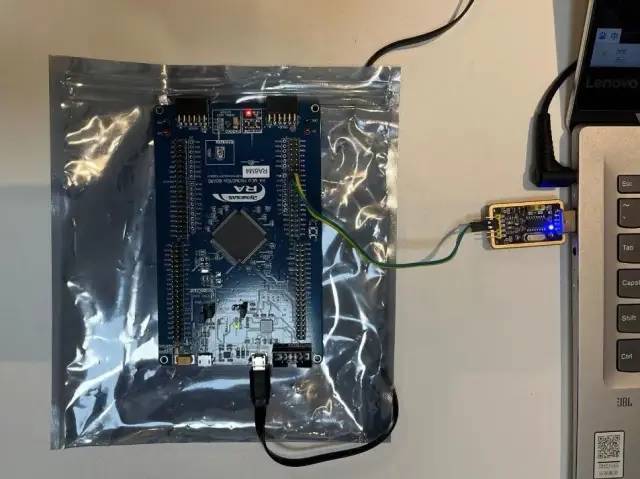
We're focusing on the main card and the serial port converter( USB to ttl ), and it's quite easy to access.

4. Add producer and consumer support to the open source PanTompkins algorithm
- First, use RT-Thread's
rt_sem_initmethod to initialize the signals that required for producer and consumer and serial port reception:
1. // Initialize the semaphore used by producers and consumers

2. rt_sem_init(&sem_lock, "lock",     1,      RT_IPC_FLAG_PRIO);
3. rt_sem_init(&sem_empty, "empty",   MAXSEM, RT_IPC_FLAG_PRIO);
4. rt_sem_init(&sem_full, "full",     0,      RT_IPC_FLAG_PRIO);
5.
6. // Initialize the serial port to receive the used signal
7. rt_sem_init(&rx_sem, "rx_sem", 0, RT_IPC_FLAG_FIFO);- Use RT-Thread's
rt_device_findandrt_device_openmethods to open the serial port of device uart7
1. serial = rt_device_find(SAMPLE_UART_NAME);
2. if (!serial)
3. {
4.       rt_kprintf("find %s failed!\n", SAMPLE_UART_NAME);
5. }
6.
7. res = rt_device_open(serial, RT_DEVICE_FLAG_INT_RX);
8. if (res == RT_EOK)
9. {
10.    rt_device_set_rx_indicate(serial, uart_input);
11. }- Main source code fragment for the producer implementation
This part is based on serial port reception, do an infinite loop to receive serial port data, because the simulation sends to each ECG data that contains n to the board, so use n as the end mark of each ECG data. After receiving an ECG data, it is put into the consumer buffer.
1.  while (1)
2.    {
3.         dataType data = 0;
4.         char ch;
5.         char str[10];
6.         int i = 0;
7.
8.         while (1)
9.         {
10.            if (rt_device_read(serial, -1, &ch, 1) != 1) {
11.                rt_sem_take(&rx_sem, RT_WAITING_FOREVER);
12.        continue;
13.            }
14.            if (ch != '\n') {
15.                str[i] = ch;
16.                if ( i < (sizeof(str) - 1))
17.                     i ++;
18.            }
19.            else {
20.                data = atoi(str);
21.                break;
22.            }
23.         }
24.
25.         rt_sem_take(&sem_empty, RT_WAITING_FOREVER);
26.
27.         rt_sem_take(&sem_lock, RT_WAITING_FOREVER);
28.
29.         pc_buffer[pc_in] = data;
30.         pc_in = (pc_in + 1) % MAXSEM;
31.
32.         rt_sem_release(&sem_lock);
33. rt_sem_release(&sem_full); }- Main source code fragment for the customer implementation
This part of the code is to implement the data input
1.     rt_sem_take(&sem_full, RT_WAITING_FOREVER);
2.
3.     rt_sem_take(&sem_lock, RT_WAITING_FOREVER);
4.
5.     num = pc_buffer[pc_out];
6.     pc_out = (pc_out + 1) % MAXSEM;
7.
8.     rt_sem_release(&sem_lock);
9. rt_sem_release(&sem_empty);- At last, use RT-Thread thread creation method
rt_thread_create,rt_thread_startupto create and enable two threads, one for producer and one for consumer.
1.    tid = rt_thread_create("thread1",
2.                            producer_thread_entry, (void*)0,                           3.                            THREAD_STACK_SIZE,
4.                            THREAD_PRIORITY, THREAD_TIMESLICE);
5.    if (tid != RT_NULL)
6.    rt_thread_startup(tid);
7.
8.    tid = rt_thread_create("thread2",
9.                            consumer_thread_entry, (void*)0,                            10.                           THREAD_STACK_SIZE,
11.                           THREAD_PRIORITY, THREAD_TIMESLICE);
12.   if (tid != RT_NULL)
13.   rt_thread_startup(tid);
5. Use Python to implement ECG data simulation input and ECG drawing.
Start from the main entry function, open a serial port COM3, and then create and enable two threads, one is to send the simulated ECG data, the other is to receive ECG data and identify the results. In the source code for drawing ECG waveforms and R-peak (red vertical lines), we're using QTimer and pygtgraph to draw the ECG graphics. Implemented Python source code:
1. import serial
2. import threading
3. import time
4. import pyqtgraph as pg
5. 
